Configuring TeamOrgChart Starter
Configuring TeamOrgChart Starter Edition is quick and easy. This guide walks through the basic steps required.
Getting Started
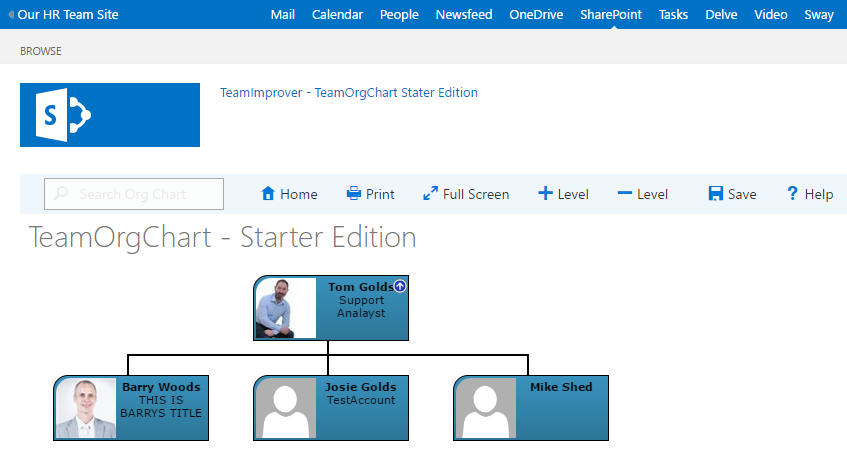
Initially TeamOrgChart Starter Edition will display a chart drawn from the SharePoint User Profile Service ( UPS ) of your SharePoint tenant.
It will start drawing the chart from the current user.
If you just see a single box then you do not have a Manager set in your SharePoint User Profile and nobody else within your organization has you set as their manager.
Setting the Start Position
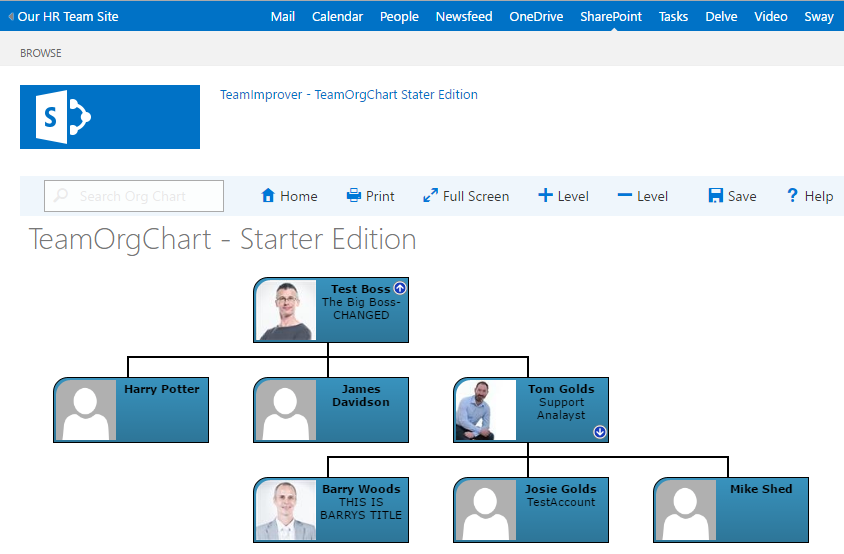
Use the navigation arrows within the chart boxes to navigate or alternatively use the search function to locate the desired starting position for your organization chart.
Adjust the number of levels you wish to display by using the + Level and - Level buttons.
Finally press Save to store the starting position and number of levels that you wish to display.
Naming the Organization Chart
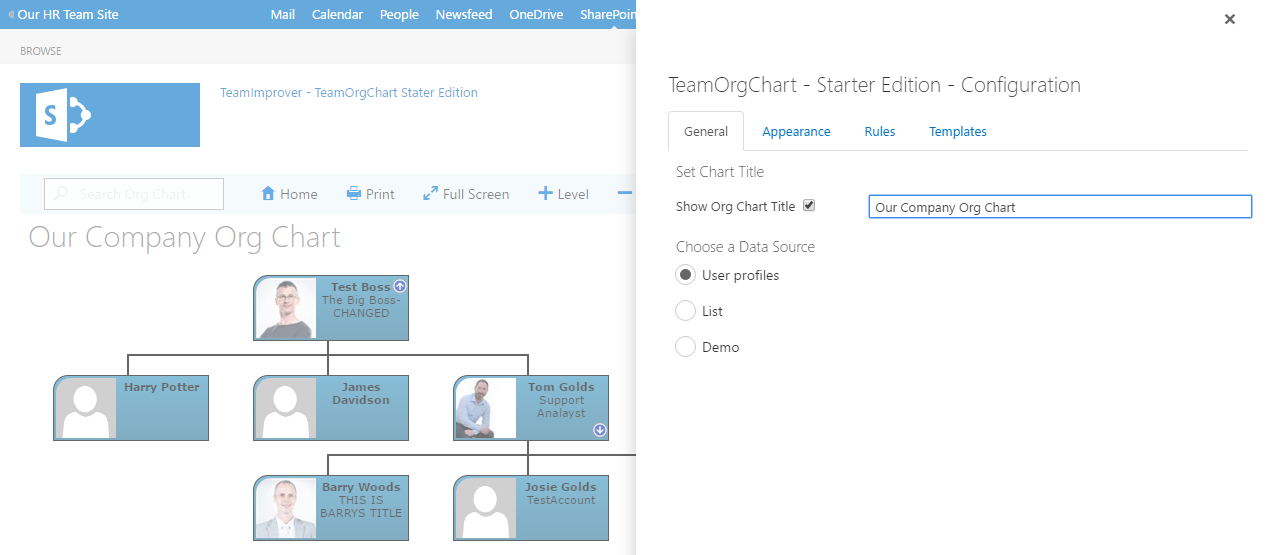
Open the organization chart open the settings panel by selecting Settings from the far right of the TeamOrgChart menu bar.
The settings panel is divided into a number of sections :
- General - set the data source and title
- Appearance - set what appears in the boxes, colors and box layouts
- Rules - create conditional formatting rules to modify the appearance of certain boxes.
- Templates - choose the information to show within the search box.
To change the name of your chart simply enter the new name into the input box. You can also use this page to hide the chart title and to change the data source that will be used to draw the chart.
Changing the Box Appearance
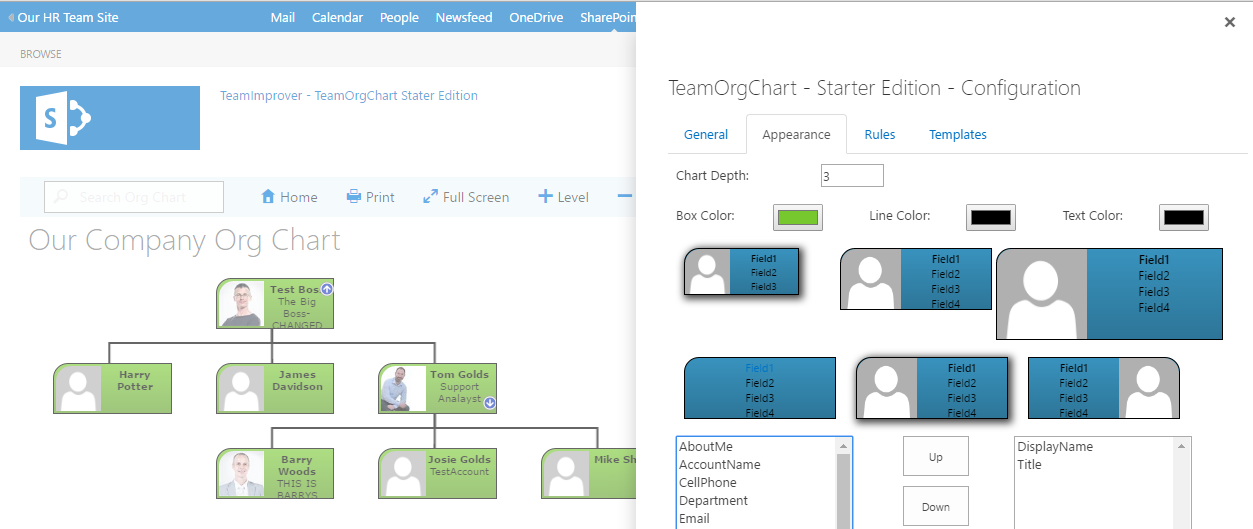
To change the appearance of the chart boxes open the settings panel using the Settings button on the far right of the menu bar then select the Appearance tab.
Use the color pickers to select the box, line and text colors to be used.
Use the "Size Picker" to select the size of the boxes and the "Layout Picker" to select an appropriate layout for your chart.
You can also choose the information that you would like to show in the boxes and the order of that information.
Create Conditional Formatting Rules

To create a formatting rule open the settings panel using the Settings button on the far right of the menu bar then select the Rules tab.
Select the rule operator and the column that you would like to test and then enter the value that should be tested.
For example entering choosing the :
- operator Contains
- column Title
- and entering the value President
creates a rule that would match anyone within the chart that had the word "President" within their job title.
The second part of the rule defines the effect that the rule has on the chart boxes. Here you can select the color, size and layout that will be applied to the box if it matches the rule.
Once the rule has been completely defined click the Save Rule button at the bottom of the panel.
Configuring the Search Template
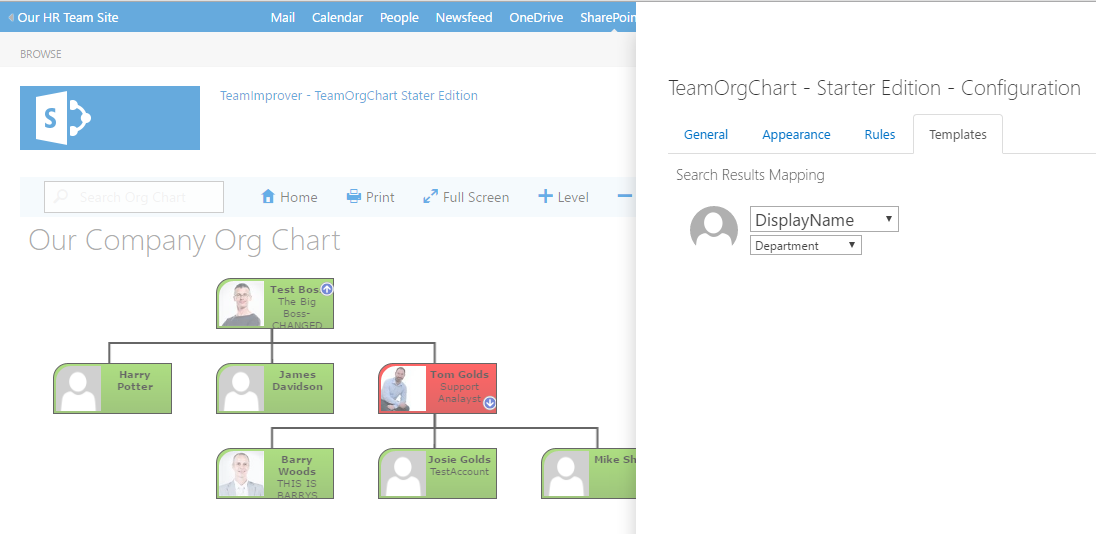
To change the information that appears in the search results open the settings panel using the Settings button on the far right of the menu bar then select the Templates tab.
Pick the fields that you wish to be displayed in the search results from the drop down lists.